Direction: Study the following Graph carefully and answer the questions given below:
-
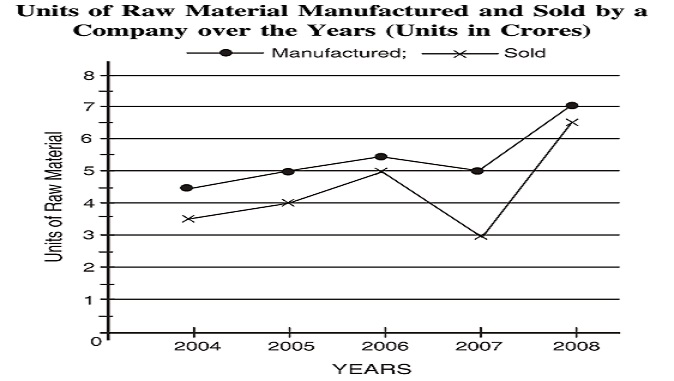
What is the approximate percent increase in the number of units sold in the year 2008 from the previous year?
-
- 60
- 70
- 95
- 117
Correct Option: D
Required percentage of increase = (number of units sold in the year 2008 - number of units sold in the year 2007) x 100 / number of units sold in the year 2007
Required percentage of increase = (6.5 - 3) x 100/3 = 3.5 x 100/3 = 117%

