Direction: Study the following Graph carefully and answer the questions given below:
-
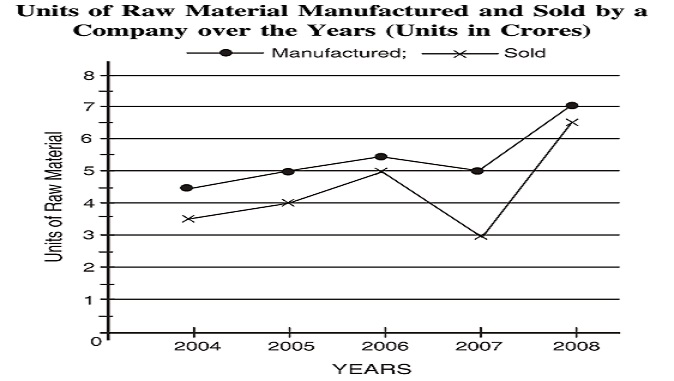
What is the respective ratio of the number of units manufactured in the year 2004 to the number of units manufactured in the year 2008?
-
- 7 : 9
- 7 : 11
- 9 : 11
- 9 : 14
- .
Correct Option: D
Required ratio = number of units manufactured in the year 2004 / number of units manufactured in the year 2008
Required ratio = 4.5 : 7 = 45 : 70 = 9 : 14

