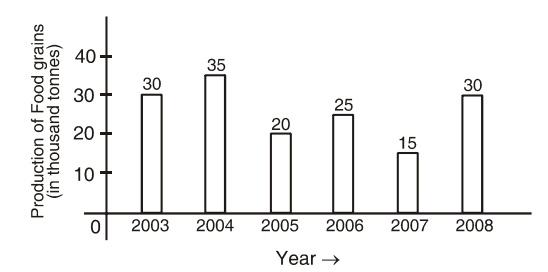
Direction: The following bar graph shows the producation of food grains in India during certain year. Study the graph carefully and answer the questions given below:
-
Rate of change in quantity of production in which of the following two consecutive years is at the minimum level?
-
- 2003 and 2004
- 2005 and 2006
- 2007 and 2008
- 2006 and 2007
Correct Option: A
Rate of change in the amount of production in the year 2004 over the year 2003 = (Production in 2004 - Production in 2003 ) x 100/ Production in 2003
Rate of change in the amount of production in the year 2004 over the year 2003 = (35 - 30) x 100 / 30 = 5 x 100 / 30 = 16.67%
Similarly
Rate of change in the amount of production in the year 2006 over the year 2005 = (25 - 20) x 100 / 20 = 5 x 100/20 = 25%
Rate of change in the amount of production in the year 2007 over the year 2008 = (30 - 15) x 100 / 15 = 15 x 100/15= 100%
Rate of change in the amount of production in the year 2006 over the year 2007 = (25 - 15) x 100 / 15 = 10 x 100/15= 66.67%
Hence, it is clear that the rate of change in the amount of production during the consecutive years 2007 and 2008 is at the highest level.

